
platypii
-
Content
94 -
Joined
-
Last visited
-
Days Won
1 -
Feedback
0%
Everything posted by platypii
-
I did actually start with httrack, but I'm not an expert with it, and switched to wget. So you are right in that sense. But I stand by my statement -- I don't think it's possible to do a good job here by taking snapshots. Basejumper.com was a dynamic site, and it would have been very difficult to get a static snapshot of it. Would you want httrack to have a copy of every permutation of "sort by date (ascending|descending), on page number (X), with (20|50|100) hits per page? It also had a "threaded" view that basically no one used, but makes for a whole new set of problems. All those links would be available to users in the mirror, so you either capture all of them, or there will be broken links. Also the site does some weird stuff: if you're logged in, it tries to take you to the last page of a thread, but once you've viewed it will take you to the first page. If you don't want "NEW" to show up everywhere you need to handle the site's logic on viewed threads carefully. The ads would have been snapshotted too, but likely would break after some time. Oh and don't forget to to block the "add friend" links or else you'll spam everyone on the site. Sorry anyone who got a friend request from throwaway6667 Those are just some of the issues I ran into before I changed my strategy.
-
I started down the path of using a scraper like httrack, but I don't think it's possible to do a good job with it in this case. The problem is that the site had url parameters like "page", "max hits" and "sort". And the button for "add friend" was an http GET endpoint. So crawling links on the page will result in weird behavior, a huge number of downloads, and still probably won't get everything. The resulting archive would be massive. I think it was actually easier to write a structured parser specifically for bj.com.
-
I fixed some of the character encoding bugs people were seeing. That should take care of the "â€" bugs. I also fixed the inline image width with a css tweak. @dmcoco84 thanks for the heads up! Also thanks to those who have donated. For those curious, it was not as simple as using a web scraper. Because of the way that basejumper.com was structured, there were "duplicate" pages based on sorting, pagination, etc. Also I wanted to make sure I got the incidents section which required being logged in. So I wrote a structured scraper that parsed each page of the forums, threads, and individual posts. Raw data was written to json files. Attachments were also downloaded. The classic bj emojis obviously needed to be preserved too Then I made a quick webapp to render the json data and as html. I exported those rendered html files to amazon S3, fronted by cloudfront. There was some hacking to get the content-type to be correct on S3. Here are downloadable archives of the rendered html, and the structured json data. @Colm @sfzombie13 https://basejumper.net/bj-html-v1.zip (820mb) https://basejumper.net/bj-json-v1.zip (50mb)
-
Approximately 1gb zipped, including all attachments. I would be happy to share copies with people so that there are backups. In case my basejumper.net mirror ever goes in.
-
People say "the internet never forgets", but that is bullshit. Archival takes a lot of hard work. Thank your local data hoarder. https://basejumper.net/ This was the main documented history of base jumping from 2002-2021. Incident reports, ideas from jumpers who are gone. I felt it was important to preserve everything, including the attachments, etc. If you see bugs let me know, I might be able to fix them. Hosting provided by BASEline. If you feel like donating, there is a paypal link on https://baseline.ws You're welcome, assholes :-) Kenny / BASEline
-
The key to the biggest flares is 1) building up a lot of total speed, and 2) efficiently converting that into a flare. This is an example of a huge flare with 314ft of altitude gain: I think it's most useful to look at the speed polar: What this shows is (1) building up a huge amount of speed by diving aggressively. (2) continuing to dive but increasing the horizontal component of velocity. (3) as smoothly as possible exchange airspeed for lift. (3) begin going up. (4) maximum upward velocity 45 mph. (5) top of the flare, when vertical velocity hits zero. If you flare too hard, or if you break it up into "phases" between 2/3/4, you will lose more energy and not gain as much altitude. Also if you flare too gradually, you will bleed off speed due to drag and not gain as much altitude. It's a balance. Interestingly on this track, (2) has more total speed than (1). I actually think it should be more efficient to not go quite as vertical as that jump, and short cut the transition from 1 to 2. The main thing is to maximize total speed before the flare, but if you can do the same total speed at 1:1 glide as when vertical, then you're in a better position to start the flare.
-
Or maybe you don't understand standard deviations. If a sky canopy opens in 500ft +/- 500ft, but a BASE canopy opens in 200ft +/- 100ft even at terminal... then no, there is virtually no difference in risk pulling at 2000ft or 500ft with a BASE rig. You might have a little more time to fix a malfunction, but the difference in risk is pretty minor in my opinion.
-
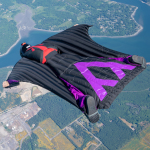
Applied Wingsuit Equations: Reconstructed roll angle from GPS data, overlayed on terrain. @yuri_base
-
Prototype GPS Speedometer DYI for around 35$
platypii replied to the.Legend's topic in Wing Suit Flying
When I said "satellites are mostly near the horizon" I meant that statistically at any given time, you are more likely to have satellites off to the side, than overhead. And If you're trying to use triangulation to measure height and vertical speed... that's going to be less accurate without satellites overhead. Geometrically it's a fact that they are more likely to be near the horizon than overhead. Here's why. If you draw a line extending out 45 degrees above the horizon, then the area of sky "above" you is much smaller than the area to the sides. I get a ratio of more than 2:1 "near the horizon" vs "above" at GPS altitudes. Picture is drawn to scale. I will say though, I expected a bigger ratio. But because GPS orbits are actually quite high, this is less of a factor than if they were in lower orbit. -
Prototype GPS Speedometer DYI for around 35$
platypii replied to the.Legend's topic in Wing Suit Flying
GPS units generally have a physics model of what is "realistic" speeds and accelerations. These are used in kalman filters to clean up noisy GPS data. It probably thinks that falling at 120mph is not realistic. Also the satellites are mostly near the horizon, so GPS is inherently less accurate on altitude than position. And finally -- check where it's mounted on your body. If its chest-mounted, you're going to be blocking its view of most of sky. Do you backfly? Cool project! -
Chest-mounted electric wingsuit motor by bmw
platypii replied to dgingold's topic in Wing Suit Flying
He's wearing a BASE rig, so no, he doesn't need emergency handles :-) -
The 3-ring wikipedia article is surprisingly detailed, with a nice animation of the mechanism: https://en.wikipedia.org/wiki/3-ring_release_system
-
Just released a new version of BASEline tonight that will scale text with the android system font size. Thanks for the feedback. Keep us posted on your project!
-
I've done this using Google Glass and it works well. I'm the developer of BASEline Flight Computer, so it was fairly easy to port the Android app to Google Glass. You can find used Glass on ebay for around $400. As you mentioned, the advantage of a HUD is that you can see horizontal speed, vertical speed, total speed, and glide ratio all at once, and with much faster update than you could ever get with audio. I personally chose to display your speed as a "polar chart". Horizontal and vertical speeds on the axes, total speed equals the hypotenuse, and glide is shown by the slope: To get good data, pair the phone with a bluetooth GPS like the XGPS160. Let me know if I can help with anything. I would love for this to exist! But I don't expect most people to deal with google glass. If interested, the google glass version of BASEline is available on a github branch: https://github.com/platypii/BASElineFlightComputer/tree/glass
-
Computing velocity from noisy position data can introduce a fair amount of error. Here is an example. Your true velocity might be constant and actually look like: But GPS will have errors that might make the position look like any of the black dots here, and you can see how much error that can introduce to the velocity if computed using distance / time: It's possible to smooth this out by adding a Kalman Filter. But a filter will introduce its own errors and create a lag time before it accurately estimates your true velocity. However, as pointed out by @crwper, GPS actually has the ability to compute position directly, not using position and distance. Instead, many GPS chips can actually use doppler shift from the satellites to directly compute velocity. The accuracy and response time is much better. It is not clear whether the GoPro uses doppler velocity to compute 2D and 3D speed, but its definitely NOT giving the individual velocity components (vN, vE, vD) which would be nice to have.
-
Actually I find the touch screen to be one of the biggest selling points of Dekunu over the X2. I own both and I HATE using the 3 button interface on the X2. Using the touch screen is so much more intuitive, way easier to find things in the menu, easier to use while on the ride to altitude, etc. On the topic of the screens, they are very different! The Dekunu has lit up screen (like a cellphone), whereas the X2 has a passive screen (more like a watch screen). Neither is strictly better than the other... X2 might be a bit better in direct sun, but overall I find it easier to read the dekunu in most cases. Dekunu has wider viewing angle, and usually its in the shade on my chest strap while wingsuiting, so the lit up screen it more readable. Plus the LCD screen on the X2 sometimes interferes with polarized sunglasses. Overall, I like the Dekunu more, but I am excited to see how both these units get upgraded over time.
-
Overall really happy with the site redesign. Great work! One super minor request: it seems like with the new CMS, the favicon disappeared. I like to keep my favorite sites on my bookmarks bar with just icons and no text:
-
Cool application of WSE: Roll Angle from GPS data! Basically, by finding the angle of the Lift vector relative to flight path, you can compute the roll angle of the suit. Here's an example of pitch, roll, and yaw reconstructed from FlySight data: This shows initial steep exit from a cliff, followed by leveling out, a slight right turn, a corkscrew (!), then a long commute before deploying. Note that the visualization assume AoA = 0. Credit to Hartman for the roll angle calc, and DFR for the corkscrew line. BASEline - Wingsuit Flight Computer
-
I'm going to preface this by saying that I'm highly skeptical of this idea, especially since you haven't even addressed how deployment would work. But... You should check out "hot wire foam cutting". There are super cheap tools available on amazon so you can do manual sculpting of foam. There are automatic hot wire cutting machines that can make them. Also some clever DIY hacks to make it cheap. High end professional hot wire cutter with overly dramatic music Very relevant DIY foam cutting of an airfoil (very long video) BASEline - Wingsuit Flight Computer
-
Yea working on an edit now, something looked wrong. In my defense, in baseline the formulas are implemented in 3D, and I had to re-do the math today for the 2D version. BASEline - Wingsuit Flight Computer
-
MAGIC-FREE L/D I mentioned in my earlier post that you don't need yuri's "magic" coefficients from WSE to compute L/D. Thought I would share the math here in case it helps someone's understanding of wingsuit dynamics. [inline magicfree1.png] The net acceleration A of a wingsuiter can be measured by GPS, and is equal to the sum of the force vectors: A = L + D + G Split the equality into its vector components. The obvious thing would be to align our coordinates with earth (x and y axes), but that makes the math tricky. Much easier if we project it onto the Lift and Drag axes: [inline magicfree2.png] Rearrange to get: [inline magicfree3.png] Since we know the velocity components from GPS: sin(theta) = vy / v and cos(theta) = vx / v. Substitute to get: [inline magicfree4.png] Boom, L/D from GPS velocity and acceleration data! No magic As a sanity check, when A = 0 it's easy to see that L/D = vx / vy = glide ratio. Exactly what we would expect for steady state flight. But this also works when accelerating. This doesn't work if there is wind, because lift and drag forces will no longer be parallel and perpendicular to the velocity vector. But it works well in low-wind situations, especially BASE jumps. Wonder if there will be more math skeptics... (edit: fixed negative) BASEline - Wingsuit Flight Computer
-
I'll let those Formula1 teams know that they should stop using wind tunnels to fine-tune their aerodynamics. I'm sure they will be grateful to save the $. In more sophisticated aeronautical engineering fields (eg- not wingsuiting) there is good uses for all these tools: instrumentation, CFD, and wind tunnels. Instrumentation might be great for measuring the absolute L/D of different suits, but if I was trying to design a better suit, tunnel and CFD will allow for much faster iteration. To be later validated by instrumentation. BASEline - Wingsuit Flight Computer
-
Yuri, wouldn't the tunnel be the PERFECT place to validate if your vane is actually giving accurate results and where to mount it? Would be great to know how much error it introduces and the stdev of the output. It's really only statistically useful for comparing suits if the difference is greater than error of the measuring device. BASEline - Wingsuit Flight Computer
-
I feel like the chart I posted could benefit from some additional explanation. This is how it maps to a skydive or base jump at a high level: [inline state-machine.png] There's a fair amount of noise, but also its possible to hit a wide range of glide ratios, as has been discussed to death in this thread. The polar view is especially interesting when it comes to flares. Here's a single wingsuit BASE jump with a really nice flare. You can see the exit, initial build up of downward velocity, followed by steady increasing horizontal speed. At the end of the jump, speed is converted into lift in the flare, and then gaining altitude before deploying the canopy. [inline polar-flare.png] The background ellipses are approximations based on the previous plot, so that you can have a quick visual reference for your speeds (UX design is research too) BASEline - Wingsuit Flight Computer
-
Not replying to any particular post, just bringing back the original topic of ws research, and thought I would share some real-world data that might be interesting to people. Data from over 2000 different wingsuit gps tracks (sky and base) plotted as a polar chart. Ground speed on horizontal axis, fallrate on vertical axis (mph). The tracks were classified by flight mode, and the points colored according to: Ground = brown Plane = red Wingsuit = purple Canopy = green [inline baseline-polar.png] This chart helped me understand the typical wingsuit performance envelope a lot better, and was critical in building a tool to automatically recognize different flight modes based on GPS data. BASEline - Wingsuit Flight Computer